
The Numbers That Tell the Story
My check engine light came on during a road trip through the mountains last fall. The car felt fine. No strange noises, no power loss, no rough idle. Just a glowing orange light on the dashboard that refused to go away. I pulled into an auto parts store, borrowed their free code reader, and got a single code: P0171, system too lean. That told me the engine was getting too much air or not enough fuel. It did not tell me why, or when, or under what conditions the problem actually happened.
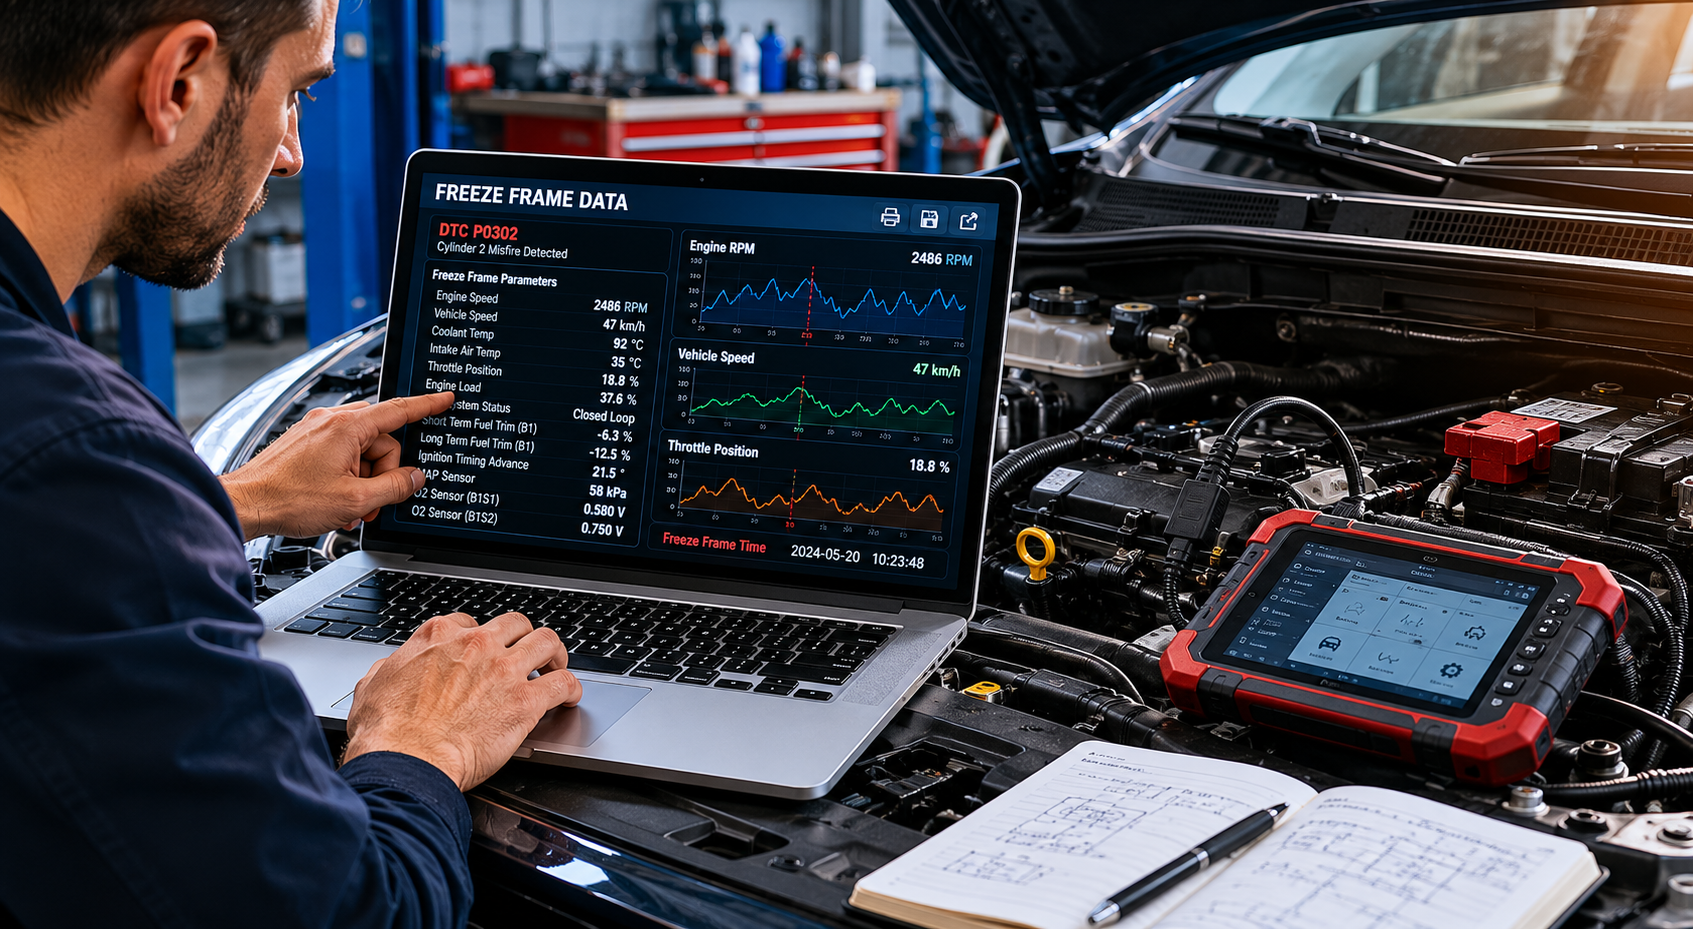
That is where freeze-frame data comes in. While the code reader sat there displaying P0171, I scrolled one screen deeper and found a table of numbers. Engine speed: 2,847 RPM. Coolant temperature: 192 degrees Fahrenheit. Throttle position: 34 percent. Vehicle speed: 58 MPH. Intake air temperature: 68 degrees. These numbers were a snapshot, a photograph taken the exact moment the engine computer detected the fault. They told me the problem happened at cruising speed on a moderate hill, not at idle or during acceleration. That changed everything about how I approached the repair.
Most people never look at freeze-frame data. They read the code, Google the meaning, and start replacing parts based on internet guesses. That approach wastes money and often misses the real cause. Freeze-frame data is the difference between throwing parts at a problem and actually understanding it. This guide explains what these numbers mean, how to read them without a mechanic’s training, and how to use them to fix your car faster and cheaper.
What Freeze Frame Data? Actually Is
Modern cars have an engine control module that constantly monitors dozens of sensors. It compares actual readings against expected values under current conditions. When a sensor reading falls outside acceptable limits for long enough, the computer stores a trouble code and turns on the check engine light. At that exact moment, it also captures a snapshot of key operating parameters. That snapshot is the freeze-frame data.
Think of it like a security camera that only records when the alarm triggers. The footage does not show everything that happened before. It shows the moment of the event and the conditions surrounding it. This matters because engine problems are often situational. A vacuum leak might only cause a lean condition at highway speed when the engine needs more air. A failing fuel pump might only stumble under heavy acceleration. The freeze frame tells you which situation was active when the fault occurred.
Not all codes generate freeze-frame data. The computer typically stores one freeze frame per code, and some less critical codes may not capture any data at all. Emissions-related codes almost always have freeze frames because regulators require detailed information for diagnostic purposes. If your code reader shows no freeze frame, the problem might be intermittent, or the code may have been set during a self-test rather than normal driving.
Why This Matters: My P0171 code could mean a vacuum leak, a dirty mass airflow sensor, a weak fuel pump, or a dozen other things. The freeze frame showed the problem at 2,847 RPM with 34 percent throttle. That ruled out idle-related causes like a cracked intake hose and pointed toward a load-dependent issue. I started checking the fuel delivery system instead of chasing vacuum leaks. That saved me hours of wrong turns.
Reading the Key Parameters
Freeze-frame data vary by vehicle, but most systems capture the same core parameters. Understanding what each number means turns a confusing table into a diagnostic roadmap. You do not need to memorize every parameter. You need to know which ones matter for your specific problem.
| Parameter | What It Tells You | Normal Range | Why It Matters for Diagnosis |
|---|---|---|---|
| Engine RPM | How fast the engine was spinning when the fault occurred | 650 – 6,000+ depending on driving | Idle problems show low RPM; load problems show higher RPM |
| Vehicle Speed | How fast the car was moving | 0 – 120+ MPH | Zero means stationary; highway speed means cruising load |
| Coolant Temp | Engine operating temperature | 180-220 Fahrenheit | Cold engines run differently; overheating causes separate issues |
| Throttle Position | How far the gas pedal was pressed | 0 – 100 percent | Low means light load; high means heavy acceleration |
| Intake Air Temp | Temperature of air entering the engine | Ambient to 40+ degrees above ambient | Hot air is less dense and affects fuel mixture calculations |
| Calculated Load | How hard the engine is working relative to maximum | 0 – 100 percent | High load with low throttle suggests engine strain |
These six parameters tell you more than the code itself. They place the fault in context. A misfire code at idle with a cold engine points to a different cause than the same misfire code at highway speed with a hot engine. The code is the headline. The freeze frame is the full story.
Connecting the Numbers to Real Problems
Reading the parameters is step one. Interpreting them is step two. This is where most people get stuck because they try to analyze each number in isolation. The trick is looking at combinations and asking what scenario they describe together.
Consider a P0300 random misfire code with freeze frame showing 1,200 RPM, 45 MPH, 15 percent throttle, and 210 degrees coolant temperature. The engine is warm, moving at moderate speed with light throttle. This sounds like steady cruising. A misfire during steady cruising often indicates a weak ignition component that fails under sustained load, like a failing coil or worn spark plug. It is not an acceleration problem or a cold-start problem. The scenario narrows the search.
Now imagine the same P0300 code with a freeze frame showing 3,200 RPM, 0 MPH, 85 percent throttle, and 160 degrees coolant. The car is stationary, engine revving high, pedal nearly floored, and not fully warmed up. This describes a hard acceleration from a standstill with a cold engine. The misfire might be caused by fuel delivery that cannot keep up with sudden demand or ignition timing that is not optimized for cold operation. Different scenario, different suspects.
My P0171 lean code showed 2,847 RPM, 58 MPH, 34 percent throttle, 192 degrees Fahrenheit coolant, and 68 degrees Fahrenheit intake air. The engine was warm, cruising at moderate highway speed with moderate throttle. The intake air was cool, meaning dense air and higher oxygen content. A lean condition under these specific circumstances suggested the fuel system was not delivering enough fuel for the actual air volume. The mass airflow sensor might be reading low, or the fuel pump might not be maintaining pressure under sustained load. The freeze frame directed my attention to the fuel side rather than the air side.
The Combination Method: Never look at RPM alone. Never look at the throttle alone. Ask what the car was doing when all these numbers existed simultaneously. Was it accelerating? Cruising? Idling at a stoplight? Climbing a hill? Descending? The scenario reveals the stress that triggered the fault. That stress is your diagnostic target.
Using Live Data to Confirm the Suspect
Freeze-frame data is historical. It tells you what happened. To confirm your theory, you need live data from the same sensors while the engine runs. Most code readers that display freeze frames can also show live data. The difference is that live data updates in real time as you drive or rev the engine.
With my P0171 suspicion pointing toward fuel delivery, I connected the reader and watched the fuel trim numbers while driving. Short-term fuel trim showed how the computer was adjusting the mixture in real time. Long-term fuel trim showed the accumulated correction over time. Both were adding fuel, which confirmed the engine was running lean and the computer was compensating. That validated the freeze frame scenario and told me the problem was ongoing, not a one-time glitch.
I also watched the mass airflow sensor reading while snapping the throttle open. A healthy sensor should show a smooth increase in airflow grams per second. Mine did. That ruled out the sensor as the primary cause and kept my focus on fuel pressure. A fuel pressure gauge at the rail confirmed the pump was weak under load. The freeze frame had pointed me in the right direction. The live data confirmed it. The pressure test sealed the diagnosis.
Common Freeze Frame Patterns and What They Mean
Over time, you start recognizing patterns. Certain combinations of parameters appear repeatedly with specific types of failures. Here are the most common scenarios I have encountered and what they typically indicate.
A code set at zero MPH with low RPM and normal coolant temperature usually means an idle or startup problem. The engine was sitting still, running at idle, and something failed. Idle air control valves, vacuum leaks at idle, and cold-start fuel trim issues fit this pattern. The engine was not under load, so load-dependent components like fuel pumps and ignition coils are less likely.
A code set at highway speed with moderate to high RPM and steady throttle suggests a cruising failure. The engine was under sustained load, everything was stable, and a component failed. Fuel delivery issues, intermittent ignition problems, and sensor drift under sustained operation fit here. These are often the hardest to reproduce in a shop because they require road testing under specific conditions.
A code set during acceleration shows high throttle position, rising RPM, and increasing load. The engine was demanding more power and something could not deliver. Fuel pressure drops, ignition misfires under load, and airflow restrictions appear in this scenario. The stress of acceleration reveals weaknesses that idle testing misses completely.
My Mountain Lesson: The 68-degree intake air temperature in my freeze frame was cooler than I expected for a warm engine. The mountain altitude meant thinner air overall, but the temperature sensor was reading actual air density correctly. The computer was calculating fuel based on that density. The lean condition was real, not a sensor error. Altitude changes how engines behave, and freeze-frame data captures those conditions. Always consider where you were driving when the fault occurred.
When Freeze Frame Data Confuses More Than Helps
Not every freeze frame is useful. Some codes are set during self-diagnostic routines rather than actual driving. The computer runs internal tests when you start the engine or under specific conditions, and these tests can set codes with freeze frames that do not represent real-world driving. A code set during an evaporative emissions test might show zero RPM and zero speed because the test happened while the car was parked. That is normal, not a sign of an idle problem.
Intermittent faults also create confusing freeze frames. The problem happened once, the computer captured the data, and then the problem disappeared. The freeze frame shows the failure conditions, but the engine may run perfectly when you check it later. This is common with failing sensors that work most of the time and only glitch under specific temperature or vibration conditions. The freeze frame is still valuable because it tells you when the glitch happened, but you may need to monitor the sensor over time to catch it acting up again.
Multiple codes can overwrite freeze frames. The computer usually stores one freeze frame per code, but if several codes are set close together, the most recent may overwrite earlier ones. If you have a P0171 and a P0300, check which freeze frame belongs to which code. They might describe different events or the same event from different perspectives. Misattributing the data leads to wrong conclusions.
Tools That Make This Accessible
You do not need a thousand-dollar scan tool to read freeze-frame data. A basic Bluetooth adapter paired with a smartphone app costs about twenty dollars and displays everything you need. Apps like Torque, OBD Fusion, or Car Scanner turn your phone into a full diagnostic display. The adapters plug into the OBD2 port under the dashboard, usually near the driver’s knees.
Standalone code readers vary in capability. The cheapest units often display codes only. Mid-range units around fifty to eighty dollars usually show freeze frames and live data. That is the minimum I recommend for anyone who wants to do more than just read codes. The ability to see live sensor values while the engine runs is worth the extra cost many times over.
I started with a basic Bluetooth adapter and a free app. It was clunky but functional. I later upgraded to a dedicated handheld unit with a larger screen and faster refresh rate. Both tools accessed the same data. The difference was convenience and speed. The data itself belongs to the car, not the tool. Any device that reads OBD2 can show you the freeze frame if the manufacturer included the feature.
Building Your Diagnostic Instinct
Freeze-frame data is not magic. It is context. The more you use it, the more intuitive the patterns become. You start recognizing that certain RPM ranges feel like highway cruising. Certain throttle positions feel like gentle acceleration. Certain coolant temperatures feel like a fully warmed engine ready for real work. These instincts develop with practice, not memorization.
The best way to learn is to read freeze frames even when you do not have a problem. Connect your reader to a healthy car and look at the live data while driving normally. Notice what the numbers do during acceleration, braking, and cruising. Then when a code sets, you have a baseline for comparison. You know what normal looks like, so abnormal becomes obvious.
I do this now as a habit. Every few months, I plug in the reader and check the data. No codes, no problems, just observation. This keeps me familiar with my car’s normal behavior and makes me faster at spotting issues when they appear. The ten minutes of monitoring is an investment in diagnostic speed later.
From Data to Fix
The ultimate goal of reading freeze-frame data is not knowledge. It is action. The data should lead you to a specific test, a specific component, and a specific repair. If your freeze frame analysis ends with a list of possible causes, you have not gone deep enough. Keep asking what the scenario demands until only one or two suspects remain.
My P0171 freeze frame led me to test fuel pressure under load. The pressure test led me to a weak fuel pump. The pump replacement fixed the lean condition permanently. The entire process took two hours of diagnosis and one hour of repair. Without the freeze frame, I might have cleaned the mass airflow sensor, replaced the air filter, and checked for vacuum leaks first. Those are all valid steps for a lean code, but they would have wasted time and money on a problem that the freeze frame had already ruled unlikely.
Data without direction is trivia. Data with context is a diagnosis. Freeze-frame data provides the context that codes alone cannot offer. Learn to read it, learn to interpret the scenarios, and your car repairs will become faster, cheaper, and more accurate. The check engine light is not just a warning. It is an invitation to understand your machine more deeply than most drivers ever bother to try.
Sources and References
- Society of Automotive Engineers (SAE). (2024). OBD-II Freeze Frame Data Standards and Specifications. SAE International.
- Automotive Service Excellence (ASE). (2023). Engine Performance Diagnosis Using Scan Tool Data. Retrieved from https://www.ase.com/
- Car and Driver. (2024). How to Read and Interpret OBD-II Data Like a Mechanic. Retrieved from https://www.caranddriver.com/features/
- Edmunds. (2023). Understanding Fuel Trim, Freeze Frame, and Live Data for DIY Diagnostics. Retrieved from https://www.edmunds.com/how-to/
- Popular Mechanics. (2024). OBD2 Scanners: What the Data Actually Means. Retrieved from https://www.popularmechanics.com/cars/
- Bosch Automotive. (2023). Engine Management Systems: Sensor Data and Diagnostic Procedures. Bosch Technical Documentation.

Written by Michael Reyes, part of the FallasDeAutos editorial team. Michael focuses on helping car owners understand and fix common vehicle problems with simple, practical guidance. His content covers diagnostics, maintenance, and troubleshooting, making complex automotive issues easier to understand. He aims to provide clear, reliable information that helps readers make informed decisions while encouraging consultation with qualified mechanics when needed.